Last week was a very hot week but not an unusual week for January. We usually see a week like that at some stage during January in each year. Something else that we also see regularly is that, regardless of the weather, coal-fired electricity continuously proves itself to be the most reliable form of mains power that we have. Without it, all of those electrical devices (such as air conditioning, fans, and heaters) which we rely on to help keep us alive during inhospitable weather, would be useless.
Figures supplied by the Australian Energy Market Operator show that between 11.30am and 4pm on Wednesday, as demand hit a daily peak of 33029 megawatts nationally, wind’s share of supply fell as low as 0.3 per cent.
[..]
The capacity factor (the amount of electricity produced compared with maximum rated capacity of the wind farm) fell as low as 4 per cent in Victoria and 2 per cent in South Australia.
In addition, graphs supplied by AEMO yesterday showed that throughout the week, demand for electricity and the capacity factor of wind generation had tended to move in opposite directions.
As Andrew Bolt points out on his blog, one of the big problems with wind power is that on very hot days there is often very little wind. I would add that the other type of hot day tends to come with very strong winds (creating dangerous fire conditions) and on those days, instead of providing more electricity, the wind is too strong for the wind turbines and they have to be allowed to spin freely with their ability to generate power disabled, as when they spin too fast, they are at very high risk of overloading.
Regardless of the wind, you would think that on a hot and sunny day there would be plenty of solar power to go around, especially with the proliferation of roof-top solar panels…no, that’s a bust as well.
More than $2 billion of subsidised investment in over 2 million rooftop solar systems contributed less than 5 per cent of peak power demand in Victoria and South Australia during the worst of this week’s heatwave.
Wind power and solar power are quite expensive when compared with coal power, and yet despite their cost they are also unreliable and unable to maintain base load power or peak demand power, and it is through the ability of coal power to cheaply and quickly adapt to changing demands for power and changing network conditions (two coal stations were offline for some hours last week at the peak of the heat due to a cable fault and a steam leak, and the remaining stations were able to pick up the slack) that the power was able to stay on.
Incidentally, it amused me to some extent that, on Friday morning while pretty much all of south-eastern Australia sweltered, two places which had been very hot during the day recorded the coldest overnight temperatures in any part of the country except Western Australia where a couple places were a little bit colder.
Goulburn was the coldest, getting down to 6.9°C (5.8° below average) after reaching 37.6°C on Thursday (9.7°C abover average) and then reaching 37.4°C on Friday (9.5°C above average). Braidwood was the next coldest, getting down to 7.5°C (4.6° below average) after reaching 36.0°C on Thursday (9.1°C above average) and then reaching 38.3°C on Friday (11.4°C above average). It is quite amazing how a place can be very hot during the day and then go on to be the coldest place in central and eastern Australia that night.
Speaking of cold weather, this is no surprise to anyone who has been following research in to how the Sun affects our climate, but it’s nice to see it getting some press coverage. Solar activity of late has been minimal and the usual 11-year sunspot cycle has failed to bring a year of great activity. There is plenty of research which shows that Earth tends to be hotter when there is a lot of solar activity than when there is little solar activity. Of late, however, the Sun has shown such a small amount of activity that there is genuine concern that we could be headed for a mini ice age similar to the one experienced in the mid 1600s.
The Sun’s activity is at its lowest for 100 years, scientists have warned.
They say the conditions are eerily similar to those before the Maunder Minimum, a time in 1645 when a mini ice age hit, Freezing London’s River Thames.
[..]
‘Whatever measure you use, solar peaks are coming down,’ Richard Harrison of the Rutherford Appleton Laboratory in Oxfordshire told the BBC.
‘I’ve been a solar physicist for 30 years, and I’ve never seen anything like this.’
He says the phenomenon could lead to colder winters similar to those during the Maunder Minimum.
[..]
Mike Lockwood University of Reading says that the lower temperatures could affect the global jetstream, causing weather systems to collapse.
‘We estimate within 40 years there a 10-20% probability we will be back in Maunder Minimum territory,’ he said.
[..]
The Maunder Minimum (also known as the prolonged sunspot minimum) is the name used for the period starting in about 1645 and continuing to about 1715 when sunspots became exceedingly rare, as noted by solar observers of the time.
While the chances of a mini ice-age are low, the chances of a prolonged period of mild cooling are much higher. This could also go some way to explaining why global temperatures have not increased for approximately 17 years and have shown a slight cooling trend over the last 5-10 years.
As I said earlier, this is not new news by any means, it’s just new research confirming much older news. Obviously we will have to wait and see what actually happens, but given the historical connection between solar activity and the climate, and the current lack of warming matching a lack of solar activity, it is certainly not unreasonable to be keeping a close eye (or properly shielded telescope) on the Sun.
I really can’t figure out why Obama made a speech about the NSA today. Usually when he makes a speech it is either him talking about how wonderful one of his ideas is (which is usually false) or is a long-winded speech without any real substance, designed to distract from whichever fiasco of his happens to be in the news at the time. Today’s speech was long-winded at a mind-numbing 45 minutes, and contained almost no substance, but there hasn’t been a predominant fiasco in the news in the last couple days so unless he was worried that the media might be bored enough this weekend to take a proper look at the Senate Intelligence Committee’s report which was highly critical of the way he and his executive team handled Benghazi, he may have just made the speech so that people would pay attention to him. Either that, or something else is happening which needs to be hidden behind the limelight of a high-profile Obama speech.
Obama’s speech today was supposedly an announcement of an overhaul of the way the NSA’s phone-and-email-and-more tapping program works. It turned out to be nothing of the sort.
President Obama announced Friday he would end the National Security Agency’s ability to store phone data collected from millions of Americans.
While the president did not say the program would end, he did say the information collected would no longer be held by the NSA. He did not offer his own plan for where the phone records should be moved and will instead call on the attorney general and members of the intelligence community to recommend a transfer point
So the NSA can collect data but can’t store it…but it doesn’t make sense for anybody else to store it so the NSA will just keep storing it.
The president’s directive, delivered at the Justice Department, also requires intelligence agencies to obtain approval from a FISA court – a secret U.S. court that governs surveillance of terrorist and foreign espionage targets – before accessing the records.
They already require this. They already ignore this. Nothing is changing.
More importantly, the accessing of the records isn’t the main concern. The main concern is that the mass and indiscriminate collection of the data is a violation of the Fourth Amendment’s protection against unreasonable search and seizure unless a court provides a specific warrant for a specific individual. If the collection was being done in a manner which was consistent with the Constitution, then accessing the records would not be a problem as the data would have been collected for the same reasons for which it would then be accessed.
FISA courts are an interesting beast as well as there is no good reason why a normal court couldn’t perform the same functions in a closed session. The records would be sealed and everything would be a secret for a period of time as determined by the court in consultation with the necessary parties. Eventually some or all details would become public, but that’s how the courts are supposed to work, even with closed sessions.
He also said that ‘dozens’ of foreign leaders would be safe from NSA surveillance techniques but did not offer that protection to their advisors.
Effectively that is saying “we will continue to spy on you, but we will do it via the people closest to you”. Another statement which changes absolutely nothing of substance.
Obama also said the government could no longer request data beyond two people from the terrorist target.
But they’re still collecting the data, and…
Obama also said the U.S. doesn’t indiscriminately snoop on people who pose no threat
As the NSA indiscriminately snoops on almost every communication which goes via an American network, and a heap of international networks as well, he has just declared that the US government sees everyone as a threat and a potential terrorist, and will continue to indiscriminately snoop on them.
Obama’s 45 minutes of droning on and on and on boiled down to a simple statement of “we will continue to spy on everyone and nothing will change that…I will, however, stand here and make noises which might make some of you think something is changing”.
While Obama tried to make it sound like something is changing, the speech is so much more transparent and easily seen through than usual that it really does make me wonder what he is trying to distract people from…because there is no other good reason for him to make such an utterly pointless speech.
I was more than a little befuddled when I heard that the Australian Government has apologised to Indonesia after the Australian Navy accidentally sailed in to Indonesian waters during an operation to turn around an illegal boat which was heading for Australia before it could reach Australia.
This is a bizarre apology in a way as, while it is nice to see the apology, the Australian Navy has entered Indonesian waters on many occasions to deal with boats which were illegally headed for Australia, and the Australian government has never had to apologise for it before now.
The only difference I can see between those previous occasions and this recent occasion is that previously, under the Rudd and Gillard governments, the Australian Navy was rescuing sinking boats and bringing the people from those boats to Australian territory (which saved Indonesia the hassle of dealing with people who, by rights, could and should have been returned to Indonesia which was the nearest port of call, and should have been rescued by Indonesian vessels anyway), whereas in this instance there is no indication that the boat the Australians intercepted was sinking and it was turned around and sent back to Indonesia rather than escorted to Australia.
It seems that the Australian government is being made to apologise for being civilised and protecting lives by sending the boat back to the nearest location, and for deterring future dangerous boat trips in the process.
In my view the Abbott government should not be apologising. The precedent for Australian involvement in Indonesian waters was set years ago and it is hypocritical of the Indonesians to request an apology now just because Australia is turning boats around instead of escorting them to Australia. The people who should be apologising are Kevin Rudd, Julia Gillard, Bob Brown, Christine Milne, Sarah Hanson-Young, and everyone else involved in the Labor/Green dismantling of John Howard’s successful border protection policies…these people lured people to their deaths by incentivising dangerous boat trips organised by people smugglers. Indonesia should also apologise for turning a blind eye to the people smugglers and avoiding their responsibility to monitor their own waters and help the many people who were in distress in those waters and were rescued by Australians in the absence of Indonesian rescuers.
The Abbott government is being nice and trying to lead a civil discourse by apologising, but until Indonesia apologise for their part in the problem and commit to properly monitoring and securing their own territorial waters, the Abbott government should not be apologising for doing the humane thing in picking up the slack and trying to save lives by destroying the business model of the people smugglers.
It’s sad but true that there is such a thing as being too nice, and when it comes to dealing with the stubborn and irresponsible Indonesian government, Tony Abbott and Scott Morrison are being too nice.
The Republican Party has started an online straw poll to gauge interest in various candidate for the 2016 Presidential nomination. While I applaud the effort, I wonder if it would be a better idea to focus on the 2014 midterm election at the moment as I think that if Republicans can gain control of the Senate and maintain control of the House, they can lay some very powerful groundwork for the agenda of the 2016 candidate.
Still, The Blaze has reposted the Washington Examiner’s list of people on the GOP straw poll and Glenn Beck and co-hosts’ reaction to it. I’m disappointed that they so quickly dismissed Herman Cain as I would like to see him run again, but I’m happy with the rest of their selections.
First, to The Blaze. My selections and thoughts follow below.
The list has 32 names, and includes governors, senators, business leaders, and more.
[..]
– Sen. Kelly Ayotte, of New Hampshire
– Haley Barbour, former Mississippi governor
– John Bolton, former ambassador to the United Nations
– Jeb Bush, former Florida governor
– Herman Cain, radio host and former CEO
– Ben Carson, author and neurosurgeon
– Chris Christie, New Jersey governor
– Sen. Ted Cruz, of Texas
– Mitch Daniels, former Indiana governor
– Newt Gingrich, former House speaker
– Nikki Haley, South Carolina governor
– Mike Huckabee, former Arkansas governor
– Bobby Jindal, Louisiana governor
– John Kasich, Ohio governor
– Rep. Peter King, of New York
– Susana Martinez, New Mexico governor
– Sarah Palin, former Alaska governor
– Sen. Rand Paul, of Kentucky
– Former Rep. Ron Paul, of Texas
– Tim Pawlenty, former Minnesota governor
– Mike Pence, Indiana governor
– Rick Perry, Texas governor
– Sen. Rob Portman, of Ohio
– Condoleezza Rice, former secretary of state
– Sen. Marco Rubio, of Florida
– Rep. Paul Ryan, of Wisconsin
– Brian Sandoval, Nevada governor
– Rick Santorum, former Pennsylvania senator
– Sen. Tim Scott, of South Carolina
– Sen. John Thune, of South Dakota
– Scott Walker, Wisconsin governor
– Former Rep. Allen West, of Florida
[..]
Names the three immediately [Glenn Beck, Pat Gray and Stu Burguiere] struck from the list included former Florida Governor Jeb Bush, Herman Cain, New Jersey Gov. Chris Christie, former House Speaker Newt Gingrich, former Arkansas Gov. Mike Huckabee, former Minnesota Gov. Tim Pawlenty, Sen. Marco Rubio of Florida, and Rep. Paul Ryan of Wisconsin.
Beck said they were either progressive Republicans, or we’ve “been there, done that.”
Many names were left on the list simply because not enough is known about their policies and beliefs at this point.
[..]
Four candidates quickly emerged as the top contenders among the group: Sen. Ted Cruz (R-Texas), Sen. Rand Paul (R-Ky.), Gov Scott Walker (R-Wis.), and former Rep. Allen West (R-Fla.).
I agree with those four being great options. I’ve been thinking about this a bit myself in recent weeks and had forgotten about Scott Walker and Allen West and am glad to see them on the list.
With the exception of Herman Cain, I would dismiss the same people (Huckabee wouldn’t have been dismissed if he hadn’t run away from his radio show late last year while blaming his syndicator for not finding him an audience…he was in Rush Limbaugh’s timeslot…if he wanted an audience, he had to build it himself rather than waiting for someone else to do it. That approach makes me worry about his passion to carve out his own success) and would also dismiss Ron Paul (not to be confused with his much more sensible son Rand).
It’s nice to see Ben Carson on the list, and I think he would make a great Cabinet secretary, but I’m not sure that he is Presidential material.
It’s also good to see Sarah Palin on the list and, if she were to run, she would have my support without hesitation.
One person I was disappointed to see missing from the GOP list is Arizona Governor Jan Brewer. As Governor she has been very successful and hasn’t been afraid to take on the federal government when it has done something which has put the interests of Arizona in harms way (eg. the Feds refusing to secure the border, making her state a major illegal entry point; and funding the Grand Canyon while the federal government was shut down so as to protect the tourism industry in Arizona which depends on the Grand Canyon). On the weekend Jan met with Rand Paul and posted a photo of their meeting on Facebook, which left me thinking about how fantastic it would be to see them both on the Presidential ticket as they’re both fantastic candidates and are so good that I wouldn’t really mind which one of them was running for President and which one was the running mate.
Alas I think Jan is more interested in serving her state than the country. This is great news for Arizona and I’m sure the rest of the country will learn things from her example, but it’s a shame for the country, even if it’s nice to see a Governor who takes the job very seriously and doesn’t necessarily see it as a stepping stone in a political career.
So, anyway, my list of preferred candidates in no particular order (other than being my picks from the GOP list first, and my additions afterwards). I’m not too fussed about who does which job, but I would like to see both the Presidential and Vice Presidential candidate drawn from this list.
– Herman Cain, radio host and former CEO
– Sen. Ted Cruz, of Texas
– Mitch Daniels, former Indiana governor
– Sarah Palin, former Alaska governor
– Sen. Rand Paul, of Kentucky
– Mike Pence, Indiana governor
– Scott Walker, Wisconsin governor
– Former Rep. Allen West, of Florida
– Jan Brewer, Arizona Governor
– Former Sen. Jim DeMint, of South Carolina (now President of The Heritage Foundation)
– Dan Bongino, former Secret Service agent and now 2014 midterm candidate for Maryland’s 6th Congressional District
– Rep. Michele Bachmann, of Minnesota
– Sen. John Cornyn, of Texas
– Sen. Mike Lee, of Utah
– Todd Starnes, host of Fox News Radio’s “Fox News & Commentary”.
Of course there are some people on that list who I think would do a better job than some other people on the list, but I have confidence in all of these people. Ideally I would probably add a couple more media people to this list, but the two I have listed are people I think would not have much to lose by leaving their media career behind to seek public office.
My ideal scenario would be a combination of someone with federal government experience and someone without federal government experience. This would provide a duo which both understands the Washington process and how to bend it to your will, while holding on to the important understanding that in the US system, the federal government is only supposed to exist to do things which can’t be logically done by a state or local government, or the private sector. I believe that all of my preferred candidates understand this, but I still think that people who have spent time in Washington D.C. can unwittingly lose sight of the importance of the smaller jurisdictions and the non-government sector, and it would be helpful to have someone there on their team to keep them on track.
I thought this was a joke at first, but no it turns out to be a real thing, and in my book that makes it even funnier.
GWN7 News in Western Australia had a story last night about a craze which is allegedly sweeping farms across the state…people taking photos of themselves with farm animals and implements. I got a good laugh out of the interview with the farmer who says it’s better than getting bored going around a paddock in circles. Some of the photos are pretty good as well.
The US Government (and in particular the Obama administration) has suffered a major setback in an attempt to regulate the Internet and the way Internet Service Providers do business.
A federal appeals court on Tuesday struck down the Obama administration’s net-neutrality rules.
The D.C. Circuit Court of Appeals ruled that the Federal Communications Commission overstepped its authority by prohibiting Internet providers from blocking or discriminating against traffic to lawful websites.
[..]
The decision is blow to President Obama, who made net neutrality a campaign pledge in 2008, and erases one of the central accomplishments of former FCC Chairman Julius Genachowski, who pushed the “Open Internet” order.
The regulations were strongly backed by Internet companies like Google and Netflix, which fear that Internet providers will charge them more for the heavy use of their sites by customers.
On the winning side of the decision is Verizon, which filed the lawsuit, and other major telecom companies. They argued the rules created a huge regulatory burden while stifling innovation in the marketplace.
The reason this is a big deal is that Net Neutrality effectively prevented service providers (both retail and wholesale) from favouring certain websites and services over others, or from offering special deals to certain websites. It was promoted as providing equal access to everyone, and to an extent it may have achieved that aim if allowed to run its course, but could only have done so at the expense of a lot of competition.
A few examples for you. Suppose Google decide to build a new data centre in Alaska and decide that building their own fibre network infrastructure there is unnecessary because there is a already plenty of fibre up there being run by three competing service providers. Google request that all three providers give them quotes to join the new data centre to the existing networks…all of them do and Google negotiate with them and eventually come to an agreement with two of the providers, one of whom will provide the bulk of the bandwidth at a cheaper rate and the other provide a bit less bandwidth at a cheaper rate, while both will have the capability (for an extra fee) to provide all of the bandwidth if the other fails. The third carrier will not have direct connectivity to Google’s new data centre but will instead use one or both of the other carriers, and will probably already have an agreement with one or both of the other carriers for network access (and if they don’t, they can route via an interstate network…it will just be slower).
Under Net Neutrality laws, it would technically be illegal for one of those providers to offer Yahoo a better or worse deal than was offered to Google. It would also be illegal for one of those providers to sign an exclusivity deal with Google whereby they would not offer their services to Yahoo and would receive an extra fee from Google as compensation, while Google would not seek out the services of other local providers…such a deal would not prevent customers of the service provider from accessing Yahoo or prevent customers of other service providers from accessing Google, but it would mean that customs of the provider with the exclusivity deal with Google would have ever-so-slightly faster access to Google, and other local providers would send extra traffic to this provider when their customers access Google as the local data centre would be faster to access than any of the interstate ones, and this would generate extra revenue for the provider with the exclusivity agreement.
Effectively Net Neutrality destroys competition which means there is no reason for prices to come down. It would also mean that, rather than having lots of redundant and cheap connectivity paths from your computer to any website via your ISP, there would be a lot fewer and more expensive paths. Speeds would also not increase as much as, without competition, there is no reason for service providers to provision services ahead of demand. You would end up with a slower, more expensive, and less reliable Internet connection, and less choices of provider.
The other argument which was often used in favour of Net Neutrality was this one, also from the article linked above:
Tim Wu, a professor at Columbia Law School, said [FCC Chairman Tom] Wheeler “has to act.”
He pointed to the court’s decision to strike down the no-blocking rule, which he said will require FCC action. “It’s just a completely different world” if Internet providers are able to keep users from accessing certain websites and services, like Netflix, Skype and YouTube, Wu said.
Let’s go back to my original example above. To recap, there are three wholesale fibre providers. Providers A and B have direct access to Google’s new data centre. Provider C does not, but connects via both A and B. A, B and C all also run their own retail ISP and other retail ISPs in the area use one, two, or all of the fibre providers to connect their customers to the Internet-at-large. In turn, A, B, and C all have their own agreements with interstate and international network providers which overlap to some extent.
In Professor Wu’s understanding of a world without Net Neutrality, Provider C could decide to block all access from their network to Google because Google didn’t give them a contract to provide connectivity for the new data centre. While this is true, it ignores all of the market forces at work on the Internet. Yes, Provider C could do this, but why would they when almost every one of their retails customers would leave them and go elsewhere, and absolutely any ISPs who solely rely on them would quickly sign up with either A or B to regain connectivity to Google. If Provider C also hosts websites, well those websites will be moved to another provider as soon as their owners realise that Google can’t see them any more.
Provider C could block Google, but they go out of business very quickly. Instead Provider C would be wise to either reach a better agreement to Provider A or Provider B for access to the local Google data centre, or with one of their interstate providers for better access to an interstate data centre, or even attract some other well-known websites to the local area under their own exclusivity arrangement. A lack of Net Neutrality laws promotes innovation among services providers and a desire to find a way to make their offering better than others.
Another problem with Net Neutrality is that it prevents niche providers from providing services to meet the specific needs of specific markets. For example, opt-in Internet filters for families who would like their ISP to block non-child friendly sites; these become illegal if implemented at the ISP level (although I’m sure the FCC would see fit to exempt such a thing). Also illegal would be an ISP specialising in pre-filtered Internet access for schools, child care centres, and summer camps…especially if it blocks Skype and the search engines and replaces them with their own VOIP and search facilities.
There is a little bit of wriggle room in the court’s ruling which allows the FCC to continue to regulate the behaviour of Internet Service Providers and perhaps even reintroduce smaller portions of bits of Net Neutrality, but for now the Internet is back to being a place of market freedom where competition makes things better for everyone.
Dr. Jennifer Marohasy has been in touch by email to let me know that, following my post earlier this week where my calculations cast a large shadow of doubt over the Bureau Of Meteorology’s claim that 2013 was Australia’s hottest year on record (not that I’m the first or last person by any stretch of the imagination to cast doubt on BOM claims about the climate), she was inspired to write an open letter to the Bureau Of Meteorology to seek information about how BOM reached their conclusions. It seems that it is Jennifer’s hope that, if more is known about BOM’s methods, it will be possible to independently work out whether their methods makes sense, and also whether their results make sense.
Seeing as we know that BOM only use a selection of weather stations in their analysis of the climate, I am hopeful that if we know more about BOM’s methods, it will be possible to apply their methodology to a calculation involving all of Australia’s weather stations. I would be very interested to see how that calculation would compare to BOM’s calculation.
I wish Jennifer all the best with her request.
Samuel
The following is a copy of the open letter sent by Dr. Jennifer Marahosy to the Bureau Of Meteorology. I have redacted her contact details, but the rest of the letter is unchanged. If you wish to contact Jennifer, contact details are available on her website http://jennifermarohasy.com/
Dr David Jones
Manager of Climate Monitoring and Predictions
Australian Bureau of Meteorology
Dear Dr Jones
Re: Request Verification of 2013 Temperature Record
I am writing to request information be made publicly available to myself and others so we may have the opportunity to verify the claim made by you on behalf of the Australian Bureau of Meteorology that 2013 was the hottest year on record in Australia. In particular it is claimed that the average temperature was 1.20°C above the long-term average of 21.8°C, breaking the previous record set in 2005 by 0.17°C.
This claim is being extensively quoted, including in a report authored by Professor Will Steffen of the Climate Council, where he calls for the Australian government to commit to further deep reductions in greenhouse gas emissions because of this “record-breaking year”. Accurate climate records are not only of political interest, but are also of importance to those of us who rely on historical temperature data for research purposes. For example, the skill of the medium-term rainfall forecasts detailed in my recent peer-reviewed publications with John Abbot, have been influenced by the reliability of the historical temperature data that we inputted. From a very practical perspective, businesses will adjust their plans and operations based on climate data, and ordinary Australians worry and plan for the future based on anticipated climate trends.
Further, I note that you said in a radio interview on January 3, 2014, following your “hottest year on record” press release that, “We know every place across Australia is getting hotter, and very similarly almost every place on this planet. So, you know, we know it is getting hotter and we know it will continue to get hotter. It’s a reality, and something we will be living with for the rest of this century.”
The Australian Bureau of Meteorology is the custodian of an extensive data network and over a long period now, questions have been asked about the legitimacy of the methodology used to make adjustments to the raw data in the development of the Australian Climate Observations Reference Network – Surface Air Temperatures (ACORN-SAT). Furthermore, questions have been asked about why particular stations that are subject to bias through the Urban Heat Island (UHI) effect continue to be included in ACORN-SAT. In particular why is ‘Melbourne Regional Office’, a station at the corner of Victoria Parade and Latrobe Street (Melbourne CBD) still included in the ACORN-SAT network when this station is known to have become sheltered from previously cooling southerly winds following construction of office towers.
I understand ACORN-SAT was used to calculate the statistics indicating 2013 was the hottest year on record, but it is unclear specifically which stations from this network were used and how data may have been further adjusted in the development of the record breaking temperature anomaly.
Rockhampton-based blogger Ken Stewart, for example, has suggested that in the calculation of the annual average temperature for Australia, the eight sites acknowledged as having anomalous warming due to the UHI would not have been included. Is this the case? I had assumed that the Bureau used all 112 ACORN-SAT locations, and thus that the record hot temperature anomaly announced by you, actually includes a UHI bias.
Radio presenter Michael Smith has given some publicity to claims made by blogger Samuel Gordon-Stewart that the Bureau has overestimated the average Australian temperature by about 4 degrees. Mr Gordon-Stewart calculated average temperatures and temperature anomalies from data from all the weather stations listed by Weatherzone.
Furthermore, given many ACORN-SAT stations have continuous temperature records extending back to the mid-late 1800s and many stations were fitted with Stevenson screens by 1900, why does the Bureau only use data after 1909, all the while claiming that 2013 is the hottest year on record? Indeed it is well documented that the 1890s and early 1900s, years corresponding to the Federation drought, were exceptionally hot.
In summary, given the importance of the historical temperature record, and the claim that 2013 is the hottest year on record, could you please provide details concerning:
1. The specific stations used to calculate this statistic;
2. The specific databases and time intervals used for each of these stations;
3. The history of the use of Stevenson screens at each of these station;
4. How the yearly average temperature is defined; and
5. Clarify what if any interpolation, area weighting, and/or adjustments for UHI bias, may have been applied to the data in the calculation of the annual mean values.
Kind regards
Dr Jennifer Marohasy
Scientist, Blogger, Columnist
This week’s joke comes with thanks to Mark McGill, who used the joke on his show during the week.
A man was looking for a job and he noticed that there was an opening at the local zoo. He inquired about the job and discovered that the zoo had a very unusual position that they wanted to fill. Apparently their gorilla had died, and until they could get a new one, they needed someone to dress up in a gorilla suit and act like a gorilla for a few days. He was to just sit, eat, and sleep. His identity would be kept a secret of course. Thanks to a very fine gorilla suit, no one would be the wiser. The zoo offered good pay for this job, so the man decided to do it. He tried on the suit and sure enough, he looked just like a gorilla.
They led him to the cage; he took a position at the back of the cage and pretended to sleep. But after a while, he got tired of sitting so he walked around a little bit, jumped up and down and tried a few gorilla noises. The people who were watching him seemed to really like that. When he would move or jump around, they would clap and cheer and throw him peanuts. And the man loved peanuts. So he jumped around some more and tried climbing a tree.
That seemed to really get the crowd excited. They threw more peanuts. Playing to the crowd, he grabbed a vine and swung from one side of the cage to the other. The people loved it and threw more peanuts.
“Wow, this is great” he thought. He swung higher and the crowd grew bigger. He continued to swing on the vine, getting higher and higher and then all of a sudden, the vine broke! He swung up and out of the cage, landing in the lion’s cage that was next door.
He panicked. There was a huge lion not twenty feet away, and it looked very hungry. So the man in the gorilla suit started jumping up and down, screaming and yelling, “Help, help! Get me out of here! I’m not really a gorilla! I’m a man in a gorilla suit! Heeelllllp!”
The lion quickly pounced on the man, held him down and said, “Will you be quiet! You’re going to get both of us fired!!!”
I’m very pleased to see that pressure from interest groups has not corrupted a contentious and important court case in Britain.
Violence broke out today inside the court where the inquest concluded into the death of Mark Duggan who was shot by police.
[..]
After a three-month inquest, the jury decided today that Mr Duggan was unarmed when he was killed but police were right to use lethal force.
[..]
A growing crowd gathered briefly outside Tottenham Police Station, including his aunt, Carole, to show their anger at the decision.
[..]
Supporters of the father-of-six reacted angrily after the jury ruled that he was lawfully killed by officers who stopped his taxi in August 2011.
His death sparked several days of riots in London and across much of the rest of the UK, and police fear there could be further disorder following the verdict.
[..]
The jury concluded that Mr Duggan was armed before his taxi was stopped, but they said it was more likely than not that he had thrown the weapon onto a grassy area six metres away from the spot where he died.
Police officers told the inquest they saw Duggan holding a firearm before he was shot.
(h/t Daily Mail reporters Rob Cooper and Anna Edwards)
The Daily Mail goes in to a lot of detail about the court case and the objections of Mr. Duggan’s family, but it’s not in anything remotely resembling a logical order…so if you want to read about it, it’s all there but is a tough read.
The point I would like to make is that British police are generally not armed, and the armed divisions are only brought in when there is a reasonable belief that firearms will be involved. In this case, the suspect was listed as one of the most dangerous people in the country so the presence of armed police was warranted and the behaviour of the suspect in brandishing the gun after police stopped the taxi was always going to cause Police to open fire.
The Police aren’t always right and it is important to have judicial oversight, but they are an integral part of a civil society and appear to have acted correctly and professionally in this matter. I can understand why Mr. Duggan’s family are upset, but threatening civil unrest over it (on the radio I heard them launch in to a “no justice, no peace” chant) is not going to help, and might just result in further unnecessary loss of life. Hopefully any protest is peaceful.
It is very good to see that, despite the clear risk of inflaming tensions among certain groups, the jury did their job and impartially judged the evidence. From an outside perspective it also always looked to me as if the Police behaved correctly in a difficult situation…I hope that for the sake of everyone, the upset groups come to realise this before they do anything which could lead to more violence.
Regardless of the short-term potential for unrest, today’s news is good for the long-term and the ability of people to have confidence in the institutions of British society and the good will of those institutions (especially the Police) toward those who wish to be part of civil society.
Over the last couple of days I’ve posted some very heavy stories on this blog, so it was great timing that I received official confirmation of my annual leave application being approved, and therefore today I can finally make the details of my trip publicly known.
The pleasing automated email I received yesterday
Long-term readers of this blog would know that I have a keen interest in US politics and the country in general, and have wanted to make my way over there for quite some time. For various reasons I had a few false starts and couldn’t go before now, and had falsely raised the hopes of a few friends over there when I thought I could go, but ended up not being able to go. (My annual leave application has been unofficially approved for months, but to avoid disappointment I didn’t want to go public until it was definitely official)
In late 2012 I saw that it looked like it was finally going to be possible and started forming a few vague plans and saving up my annual leave (hence the reason I can take so much time off work). It quickly became apparent that, as people I know in the US had spread out across the country quite a bit of late, visiting most or all of them was going to be best accomplished by doing something else I’ve wanted to do…go for a driving holiday in a foreign country.
I started planning the trip based on driving everywhere and stopping in interesting places along the way. This plan, due to time and budget constraints, turned out to be a “go go go” trip with minimal time in each location, so then I started dropping some of the places that were of a lower priority (I can always see them at a later date) and then with a solid basis for a plan, added a little time in some places to give me more time to account for possible weather delays and a public holiday.
What I ended up with is this.
Click map to enlarge
This map shows all of the main destinations for my trip. How I plan for it to unfold is like this:
Tuesday 11 Feb
Depart Australia. Flying from Canberra to Sydney, then Sydney to Los Angeles, and Los Angeles to San Francisco.
Thanks to the time difference I should get to San Francisco around the middle of the day, however I am not staying in San Francisco as I am hiring a car and driving straight to Petaluma which is a small town about an hour north of San Francisco.
With all going well, I should get to the hotel with a couple hours left before sunset.
Wednesday 12 Feb and Thursday 13 Feb
On the Wednesday I’m going to visit the studios of TWiT.tv, Leo Laporte’s technology podcast network (I interviewed Leo when TWiT was just starting to grow back in 2006) and am planning to use the rest of my time in Petaluma getting over any jet lag and doing some sightseeing around Petaluma and San Francisco.
Friday 14 Feb
The full day is set aside (and will be needed) for a drive to Las Vegas. I’m sure there will be a few stops along the way, and I plan on ensuring Bakersfield is one of them.
Saturday 15 Feb – Thursday 20 Feb
This time will be spent in Las Vegas with the possibility of some brief trips to nearby places of interest. People who have been reading this blog for a long time will know that I have quite a few friends in the Las Vegas area…my visit to Vegas is probably not going to be the normal visit of a tourist but I’ll still be doing some of the “tourist things”. I have arranged to meet some friends in Vegas already and hope to make many more plans as well.
Friday 21 Feb
On this day I will be returning the car I have hired and will be flying to Kansas City. I could not get a direct flight to Kansas City and so this trip will take most of the day, but is quicker than two full days of driving. Upon arrival in Kansas City I will be picking up another hire car…one more suitable for the rather cold locations which make up the rest of the trip.
Saturday 22 Feb
I’m looking forward to seeing the interesting sights of Kansas City and meeting a friend who used to live in Vegas.
Sunday 23 Feb
I’ll be driving to the town of Fort Dodge, Iowa on this day. This should only take a few hours so I may have a bit of spare time in Kansas City in the morning and some in Fort Dodge in the afternoon.
Monday 24 Feb
This will be a day for some sightseeing in Fort Dodge and meeting Bill Grady (Bill and I interviewed each other a few times in 2006 and have kept in touch since). Bill is a really good guy who now runs a news website for Fort Dodge and to whom I give lots of credit for sparking a lot of my interest in US news and politics, and being the first person to properly explain to me the 2nd amendment and its historical reason for being.
Tuesday 25 Feb
I’ll be driving to South Bend, Indiana on this day. Given the distance and the fact that I lose an hour by crossing from Central Time to Eastern Time along the way, the full set of daylight hours has been allocated to this.
Wednesday 26 Feb – Sunday 2 March
South Bend, near the Indiana/Michigan border will my base for this time.
Long-term readers of this blog would be familiar with the name Casey Hendrickson. Casey now resides and works near South Bend and I’m looking forward to meeting Casey and some other friends in Indiana during this time.
Other highlights will hopefully include a trip to the nearby town of Hillsdale, Michigan where the fantastic Hillsdale College is (seeing their life-size statues of Ronald Reagan, Margaret Thatcher, and other historical figures is something I’m very excited about), and I’m looking forward to trying out a new shooting range at Rocket Guns in Goshen, Indiana.
Monday 3 March
Another one of my full day drives…this time to Arlington, Virginia which is just outside Washington D.C.
Tuesday 4 March – Friday 7 March
I’m very much looking forward to seeing D.C. and a lot of the nearby spots including Baltimore and Leesburg. If time permits, I might also make a day-trip out of a visit to a friend in New Jersey.
Saturday 8 March
This is the day that I depart from the US. I’ll drop off the rental car and fly out from Reagan International Airport, heading to Canberra via airports in Los Angeles and Brisbane. I’ll be back at home late on Monday the 10th of March, leaving me the better part of two weeks at home before I have to go back to work (and probably make up for my absence with Pebbles).
I’m looking forward to it very much and will provide some more details before I go. I also hope to keep this blog updated with details from my trip while I’m over there.
In recent times there has been quite a bit of attention paid to a seemingly growing trend of people in night-time entertainment districts being attacked with a single punch, often referred to as a “king hit”. (There has also been a push to drop the word “king” and replace it with “coward” but, while I understand why people might think a grand word like “king” is out of place in this context, changing the name seems like political correctness guided by unnecessary social engineering to me).
The single-punch attacks in Australia have been placed in the category of “alcohol-fuelled violence” due to their usual proximity to night-time entertainment venues. Alcohol probably plays a part, but I’m not convinced that curbing the trading hours of pubs and clubs (as has been suggested by many people) will solve the problem as I think it’s a cultural issue more than an alcohol issue.
My reasoning for this is that the single-punch attacks are strikingly similar to a growing trend in the US called “the knockout game”. This “game” effectively involves people wandering up to a random target and attempting to knock them out with a single punch to the head, with the target usually being picked along racial lines. Predominantly it has been black people attacking white people, although not exclusively, and because the mainstream media in the US tends to be more interested in white-on-black violence than black-on-anyone (white, black, Hispanic, etc) violence, it took some time for it to receive widespread coverage (I must congratulate Fox News’ Greta Van Susteren for being one of the leading figures in bringing it to light) and by the time it got that level of coverage we were already seeing the similar non-racially motivated attacks here in Australia.
As odd as it is, these attacks seem to be a cultural fad adopted by people who were probably already willing to be violent in public for no reason…it’s just that the fad made it more acceptable in certain circles.
In Australia, while the attacks have predominantly occurred near alcoholic night-spots, the attacks don’t seem to be related to the usual squabbles and punch-ups which regularly occur between certain late-night drunks as evidenced by the fact that some of these attacks have occurred in the early hours of the evening before the usual round of drunk squabbles. For this reason, it seems unlikely to me that making venues close earlier will solve the one-punch attack problem, even if it might solve some other issues which I’ll address shortly.
For the single-punch attacks, existing laws regarding assault and homicide cover most bases, but there is a push in the US and a similar push here to treat this type of assault more seriously than some other types of assaults. This seems like a reasonable adaption of existing laws to a new problem, and I support this move. Treating this type of assault as grave and malicious, and having minimum prison sentences of five or more years, with the minimum duration being higher if the victim dies, would solve most of the problem in my view, and provide police, prosecutors, and judges with the necessary legislative instruments to deal with such offenders.
As I said though, I think the problem of general drunken alcohol-fuelled violence is mostly-unrelated to the single-punch attacks. I suspect the later opening hours we have for pubs and clubs now compared to some years ago are part of the problem as large groups of drunk people are able to stay in a concentrated area for a longer period of time than in years gone by. Previously, if people wanted to keep drinking until sunrise, they had to disperse to separate areas and the people in those areas generally knew each other, whereas now large groups of strangers are in a concentrated area.
That said, the vast majority of people who are out all night are well-behaved and it seems unfair to punish them or the pubs and clubs which have simply responded to market demand, for the bad deeds of a minority.
To my mind, people who are out that late accept the possibility that they might inadvertently be involved in a squabble and it is their right to take that risk. Things can be done to minimise the risk though.
At the moment pubs and clubs can get in a lot of trouble and potentially lose their liquor licence if trouble breaks out on their premises, and so they tend to send potential trouble-makers out on to the street where the trouble seems to escalate. If pubs and clubs weren’t held as responsible for bad behaviour on their premises, they wouldn’t need to be as quick to kick out potential trouble-makers (which is a confrontational process anyway) and their staff could usually contain and squash trouble before it gets out of hand. The staff in these places are generally quite good peace-brokers.
This would have the effect of not having trouble-makers from multiple areas all being sent out on to the street to confront each other, resulting in a lack of escalation of problems, and police generally only having to deal with the worst offenders. This would make things safer and free up police and the courts to take the necessary time to come down hard on the real trouble-makers.
Reduced opening hours may force a reduction in street violence, but it’s at a cost to the liberty of the well-behaved and the freedom of the marketplace, and I think it is a heavy-handed approach which is better-used as a last resort after trying less heavy-handed approaches first.
The Bureau Of Meteorology released a statement on Friday which claimed that 2013 was Australia’s hottest year on record, with an average temperature of 23 degrees which, according to them, is 1.2 degrees above the long-term average. The numbers just didn’t quite seem right to me as 23 degrees seems like a an average maximum temperature, simply because of the massive areas of the country which struggle to reach 23 degrees during the day for much of the year, and that overnight lows don’t spend much time hovering as high as 23 degrees in much of the country for much of the year.
During the year I had also checked some of the average temperatures in different places against the long-term average and quite often found that while daytime maximums were up (although not usually by anywhere near as much as 1.2 degrees), overnight minimums were generally quite in-line with the long-term average and had occasionally been up, but had also been down on a regular basis.
With this in mind, I decided to check the numbers myself and I’ve gone in to some detail about how I did this below.
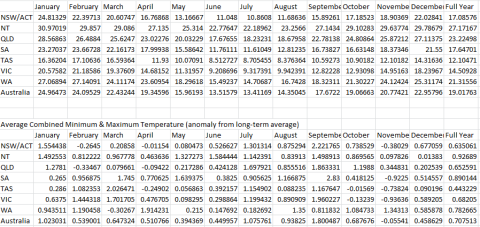
But first, what I found was that the average temperature in Australia in 2013 was not 23.0 degrees as the Bureau claimed, but 19.01762629 degrees. The Bureau’s numbers are nearly a full four degrees too hot! This also worked out to be 0.707512656 degrees above the long-term average, not 1.2 degrees as claimed by the Bureau.
Table of the combined minimum/maximum average temperature in Australia for 2013
Given the Bureau are basing their 1.2 degrees above average figure on 100-or-so of the oldest weather stations in Australia and my numbers include a bunch of newer stations in addition to the older stations, and there was a general warming trend globally through the 1900s (although not over the last 17 years) it’s possible that my long-term average is higher than the Bureau’s long-term average, resulting in some of the discrepancy between the 1.2 and 0.7 figures…but even then, their long-term actual average temperature should be lower than mine, so the fact that they’re claiming the long-term average temperature is 21.8 degrees proves that either they have increased their historical numbers and 2013 numbers, or their long-term average is accurate but their 2013 number is dodgy and 2013 was actually colder than the average and my numbers think it was above average because Weatherzone’s historical data has been corrupted by manipulated Bureau data. Either way, the Bureau’s numbers are suspicious.
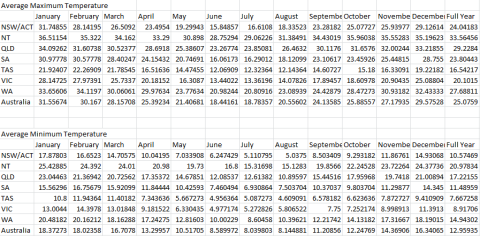
From my numbers, the average maximum temperature in Australia was 25.07590106 (0.909824103 above the long-term average) and the average minimum temperature was 12.95935152 (0.505201209 above the long-term average). The more I think about it, and the more I’m reminded of the ways in which various government weather services and climate researchers have been found to have manipulated numbers to “prove” global warming is accelerating (which it isn’t), the more I think the long-term averages are manipulated so as to be lower than the real number, this making warm years look very hot. Proving it would be another matter entirely, but given the bizarre nature of the differences between the long-term averages I have been using and the long-term averages the Bureau have been quoting, it makes sense.
Table of the average minimum and average maximum average temperature in Australia for 2013
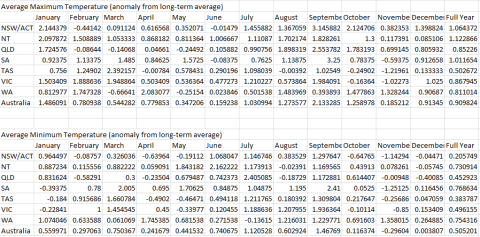
Table of the how far above or below average the average minimum and average maximum average temperatures in Australia were in 2013
Some of my findings did correlate with the Bureau’s findings. For example, the Bureau said:
All states and territories recorded above average temperatures in 2013, with Western Australia, Northern Territory and South Australia breaking their previous annual average temperature records.
I concur that all states appeared to show an increase against the long-term average (bearing in mind my earlier caveat about my doubts about the long-term average data being accurate) and WA, SA and NT were the three most above-average…although whether they set records or not, I can’t say as I wasn’t checking that.
I disagree with the Bureau on another point though.
The year started with a persistent heatwave in January, with Australia recording its hottest day (7 January), hottest week, and hottest month on record.
I have previously demonstrated that the Bureau wildly exaggerated the January heat, but now I have a little bit more to work with.
According to my numbers, January’s average temperature was 24.96473243 degrees (1.023030725 above average), and February was 24.09528836 (0.539000779) above average). This means that January’s average temperature is around 23.9 and February’s is around 23.5. This works out to be about 0.76 above average for the combined months of January and February.
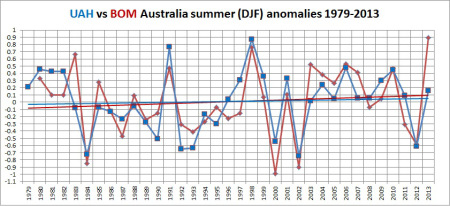
How interesting it is then, that the satellite data doesn’t agree. Satellite data plotted against Bureau data. Satellite data obtained from NASA satellites and the University of Alabama in Huntsville. Courtesy of Ken’s Kingdom.
Huge discrepancy…the satellite data doesn’t lie, so the Bureau’s long-term averages are clearly being distorted to make slightly warm years look like a convection oven.
It occurs to me that 21.8C, the average temperature in the Bureau’s press release but not in their weather data, might be the real average and they might be using that in their press releases to avoid anyone running the raw historical numbers and quickly proving it wrong…if so, then 2013 with its average around 19C was actually a below-average year.
The other bizarre thing about the Bureau’s press release is this:
hottest
[..]
hottest
[..]
above the long-term average
[..]
breaking the previous record
[..]
above average
[..]
breaking their previous annual average temperature records.
[..]
persistent heatwave
[..]
recording its hottest day (7 January), hottest week, and hottest month on record.
[..]
exceeded 39°C
[..]
The highest temperature
[..]
the highest temperature
[..]
The January heatwave
[..]
temperatures have warmed
[..]warmest on record.
These are all of the relative references to temperature (eg. “hot”, “warm”, “cold”, “chilly”) from the press release. Notice something missing? Yep, the Bureau completely forgot to mention that there were some cold months as well.
From my numbers:
Nationally, November was below the average temperature.
NSW/ACT: February, April and November were below average
QLD: February and April were below average
SA: November was below average
TAS: April, October and November were below average
VIC: October and November were below average
WA: March was below average
NT did not record a below average month (odd, but not implausible, considering that Northern Australia has not warmed for 31 years)
Additionally, May and June were quite mild months across everywhere except the Northern Territory, and December was quite mild right across the country.
It seems to me that the Bureau have been exaggerating warm weather again while ignoring cool weather, and while I can’t definitively prove that their long-term average temperatures are a work of malicious fiction, I can and have proved that Australia is nowhere near as warm as they claim, and 2013 certainly was not an abnormally hot year.
Update 7:12pm: Satellite data for Australia for 2013 has just been released and it shows that 2013 was an above-average year for temperatures, but not by as much as claimed by the Bureau. Over at Ken’s Kingdom (see link in previous sentence) Ken posits that part of this discrepancy is caused by the scarcity of weather stations in remote inland areas being included in the Bureau’s dataset (a problem my dataset doesn’t have as I used all available weather stations and not just a select group of them) which results in Alice Springs having too much impact on the Bureau’s numbers.
The satellite data (which only goes back to 1979) says 2013 was the hottest on record for satellite data, but given that it was not as hot as Bureau data suggests and there were many years in the early 1900s which were recorded as being hotter by Bureau data than some recent years’ satellite data despite a severe lack of inland weather stations in hot places back then, I maintain that 2013 was not hotter than some of those early 1900s years and was therefore not the hottest year on record). End Update
The method for these findings
The Bureau provide data about daily maximums and minimums, but when I started analysing the data a few days ago they had not released any of the 2013 data, as as I write this they have only released the minimums for 2013 and not the maximums. One could wonder if they’re waiting for public interest in their statement to wane before releasing the data which can be used to check the validity of their statement, especially seeing as the dataset they release only covers about 100 weather stations across the country and all of the records for 2013 are stored in a computer format which can easily be added to the existing dataset.
The fact that only 100-or-so weather stations are covered by the Bureau’s dataset is also troubling as there are more than 700 official weather stations in Australia. The other problem with the Bureau’s dataset is that, to quote them, it is:
a complete re-analysis of the Australian homogenised temperature database [..] and utilises improved analysis techniques.
Given the Bureau’s recent history in claiming temperatures are hotter than they actually are, I can’t be entirely sure that any dataset which they have “homogenised” is going to be accurate and not skewed, so I went for data from an independent source which keeps a note of Bureau data on a minute-by-minute basis: Weatherzone.
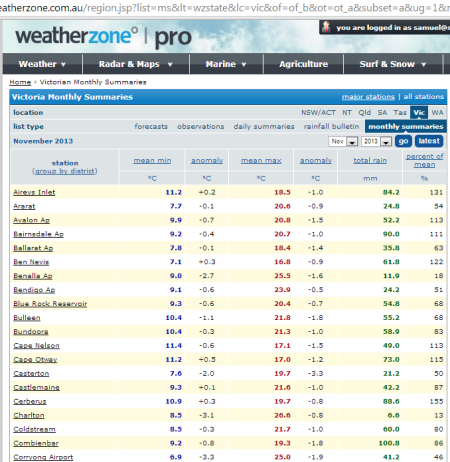
Weatherzone pay the Bureau for access to their raw data from weather stations, radars etc and keep track of it themselves. On a day-today basis they use this data to help formulate their own weather forecasts, including for some things which the Bureau does not provide a forecast. More helpfully for this exercise, Weatherzone maintain a bunch of monthly summary pages for each state (eg. this one for Victoria for November), based on the live data they have collected from the Bureau throughout the year. These pages track the average maximum and minimum temperature and rainfall for each weather station in the country.
Part of the Weatherzone Monthly Summary page for Victoria for November 2013
If you click on any of the weather stations, you can get a summary for each day showing the actual minimum and maximum of that day, and it is possible to then click on any day and obtain the exact details of the weather in that location at each half-hour through the day. Alas there is no easy-to-download version of this data, so as much as I would like to use the daily minimums and maximums, or the temperature from each half-hour which would be even better, the data would need to be copied and pasted manually in to Excel (and then reformatted slightly to ensure numbers are all on the same row as the name of the weather station), so I settled for the monthly summaries as the average temperatures listed there are what the data from the daily and half-hourly pages would boil down to anyway.
It took many hours of copying and pasting and reformatting, partially because the numbers were pasting below the weather station name and I had to build a macro to move the numbers on to the same row as the weather station name, and partially because whenever Weatherzone’s page detects a record number it highlights it and puts another number in front of it (the number of years which records have been kept at that weather station) and thus I also had to manually go through and remove the year number so that I didn’t have cells claiming that the average temperature in a location was 8,000 degrees or more.
I separated the spreadsheet in to different worksheets for each month, and another one for the overall numbers for the year. Each month’s worksheet was broken up in to sections for each state and territory (although the ACT and NSW were lumped in together).
At the bottom of each state’s data, formulas were run to:
A) Add all of the numbers so that I could quickly check the averages without having to manually add all of the data
B) Using Excel’s “average” function which ignores cells which do not have data (this was vital as some stations could not provide a long-term average as they have been in operation for less than ten years, occasionally a station might not report in a given month, or a station might be start or cease operations in a month and it was quicker to copy and paste the formula between months than to manually build it each each month), calculate the average figure for minimum temperatures, maximum temperatures, difference from long-term average for the aforementioned.
C) Using the calculated averages mentioned in “B” above, average those numbers (as equal weighting is to be given to minimums and maximums) for the combined minimum and maximum.
At the bottom of each monthly worksheet a similar process was undertaken to come up with national numbers, however as there are a different number of weather stations in each state, the state-based averages could not be used for calculations as it would give unfair weighting to smaller states…instead, averages were calculated using every single weather station.
On the “2013 Totals” worksheet, the numbers reached in the above monthly state and national calculations were sorted in to tables to group all of the average minimums and group all of the average maximums etc. To reach a full-year figure for each location, each month was given a weighting equivalent to the number of days in the month so that the annual figure could be truly an annual figure and not be skewed in favour of the shorter months. So, for example, the number for January was multiplied by 31, the number for February by 28, etc, and then the total number was divided by 365.
For anyone who is interested in the raw data (perhaps you would like to see my findings for yourself, or just check out the data for your local weather station), the spreadsheet can be downloaded here.
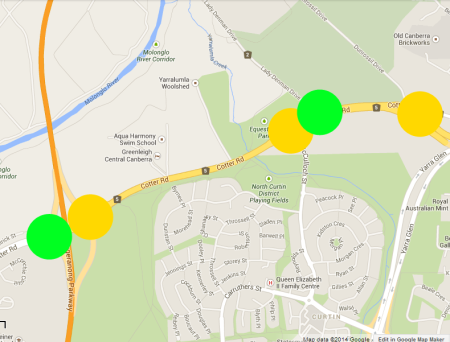
At about 3:20am today, I noticed some rather unusual behaviour in the traffic lights on Cotter Road between the Tuggeranong Parkway and Adelaide Avenue.
At first what I noticed was that one set of lights on the overpass over the Tuggeranong Parkway was flashing amber while the other set of lights was behaving normally. This is a little odd as the two sets of lights are linked so as to improve traffic flow in the area, but it’s not uncommon for a single set of lights to act-up and for a linked set of lights to carry on using only its own sensors, so I didn’t think much of it until I got to the next set of lights at the Cotter Road/McCulloch St intersection as these lights were also flashing amber. This set of lights are not linked to the ones near the Tuggeranong Parkway and it seemed very odd to have two unconnected sets of traffic lights in such a small area acting-up without any odd weather or some deliberate police activity (of which there was none).
It got stranger just a few metres away at the Cotter Road/Lady Denman Drive intersection where the traffic lights were behaving normally. These lights are linked to the McCulloch St lights and it is definitely peculiar to have two pairs of linked lights where one of each pair is misbehaving in such close proximity. It became bizarre enough for me to call Canberra Connect (the ACT Government’s call centre) to report the issue when, a bit further down the road, a completely independent set of lights at the Cotter Road/Dudley Street intersection was also flashing amber.
Green dots indicate working traffic lights. Yellow dots indicate lights which were flashing amber.
When I rang Canberra Connect I was asked if I would like to hear back from someone about my report and I am starting to wish I had said “yes”. Even though I doubt I would really hear back about this issue, and even if I did it would probably just be from someone telling me that the problem was fixed within a certain time-frame, I would be interested to know what caused this problem. It seems to me as if someone may have been a bit naughty and fiddled with a few control boxes, but it could also have been caused by a technical problem of some sort, and I’d be fascinated to know what sort of technical fault could affect some lights and not other in that manner.
I suppose it’s just one of those interesting mysteries of late-night driving in Canberra.