Barack Obama’s Rasmussen approval ratings for August and September
October 2nd, 2009 at 07:07am
I didn’t produce one of the updates at the end of August because I was in Deniliquin and didn’t find the time in the first week or so, and then couldn’t really see the point in producing one in the middle of the month. I know that I have produced these reports mid-month before, but it’s a fairly futile exercise…none of this stopped me from receiving an email from somebody who claimed that I was being “more biased than usual” by not producing the August report. They might have had a point if it weren’t for the fact that Obama suffered his lowest raw approval rating to that point on the last day of August.
Anyway, as I didn’t produce one of these reports at the end of last month, I’m consolidating the August and September reports in to this update.
As usual, the figures presented herein are taken from the Rasmussen Daily Tracking Poll.
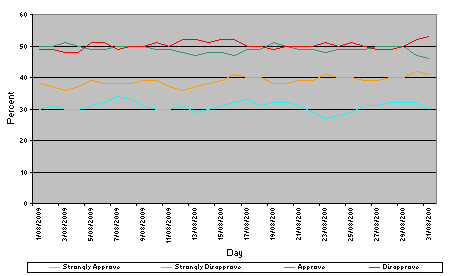
August saw the numbers stay roughly where they left off in July, with almost two thirds of the month being spent with a lower than 50% approval rating. There weren’t any noticeably good periods in there, but there was a period of about a week in the middle of the month where Obama’s approval fell in a hole, but recovered, only to suffer its worst drop ever at the end of the month, finishing on a record low of 46%
Data courtesy Rasmussen Reports, LLC
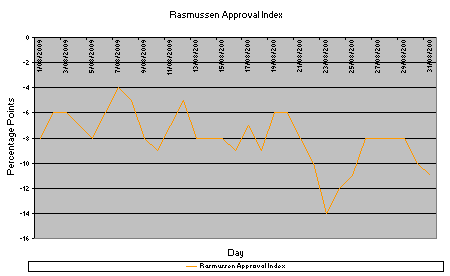
The Rasmussen Approval Index which measures the “strongly approve” vote against the “strongly disapprove” is often regarded as an indicator of where the raw approval and disapproval numbers will go, as people with strong views are likely to try to influence the views of others. In August, it did just this, hitting a record low of -14 on the 23rd, before recovering and echoing the raw approval dive at the end of the month.
Data courtesy Rasmussen Reports, LLC
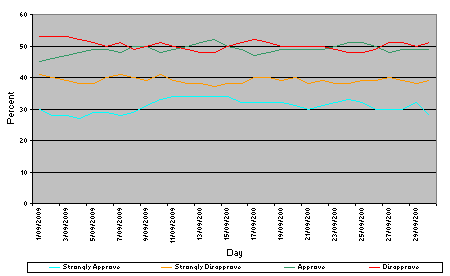
September is one day shorter than August and saw Obama’s approval sit under 50% for one more day (20) than it did in August, starting at a new record low of 45%. It did have a good recovery though, spending much of the month around the 50% mark.
Data courtesy Rasmussen Reports, LLC
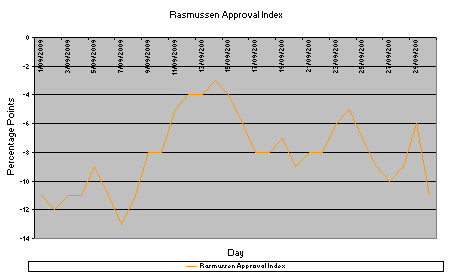
The Rasmussen Approval Index mirrored the recovery in the first half of September, getting up to -3, but then quickly fell back to around the -8 and -9 mark. It finished the month with a dive to -11, but if the recent pattern is anything to go by, that’s probably the low end of the cycle. It will most likely come up again in the next few days before going down again. It’s the trend of the numbers in the middle of the cycle that count.
Data courtesy Rasmussen Reports, LLC
And as usual, to put this in context, here are the graphs for all of 2009.
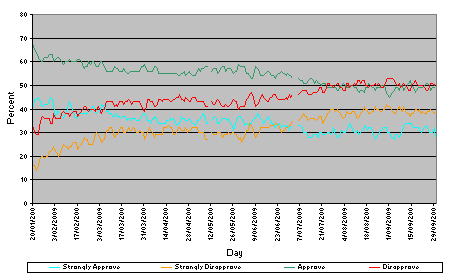
Data courtesy Rasmussen Reports, LLC
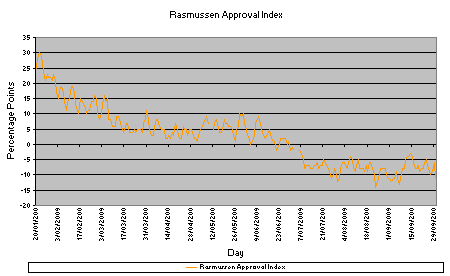
Data courtesy Rasmussen Reports, LLC
The approval numbers seem to have stopped their dive for now, sitting just under 50% most of the time, but the interesting thing is that it looks like the Rasmussen Approval Index is starting to go down again. It will take another week or so to see a clear trend on that, but it’s worth watching, as it tends to be a bit ahead of the raw approval numbers when it comes to the overall trend.
Samuel
Entry Filed under: General News
