Canberra Radio Ratings #2 for 2007
September 19th, 2007 at 06:30am
Late last week Nielsen Media Research released the results of the second survey of radio listeners in Canberra for 2007. For the last few ratings I haven’t managed to produce a statistical analysis of the ratings due to the amount of time it takes, however this time I have gone to the effort of putting all the ratings results since 2005 in to a spreadsheet, this not only allows me to automate the calculations required for the analysis, but also allows me to create graphs. As such, you can expect much more interesting ratings results from me from now on.
So, without further ado, the ratings.
| Position | (Last Survey) | Station Name | Score | (Last Survey) | Change |
| 1 | 1 | 666 ABC Canberra | 18.7 | 18.5 | +0.2 |
| 2 | 2 | FM 104.7 | 18.6 | 18.4 | +0.2 |
| 3 | 3 | Mix 106.3 | 17.4 | 18.0 | -0.6 |
| 4 | 5 | JJJ 101.5 | 9.0 | 8.7 | +0.3 |
| 5 | 4 | 1206 2CC | 7.9 | 8.9 | -1.0 |
| 6 | 6 | ABC Radio National 846 | 7.6 | 8.2 | -0.6 |
| 7 | 9 | 1053 2CA | 6.6 | 4.3 | +2.3 |
| 8 | 7 | ABC Classic FM 102.3 | 6.2 | 7.3 | -1.1 |
| 10 | 10 | ABC NewsRadio 103.9 | 3.4 | 2.7 | +0.7 |
| 9 | 8 | Other | 4.6 | 5.0 | -0.4 |
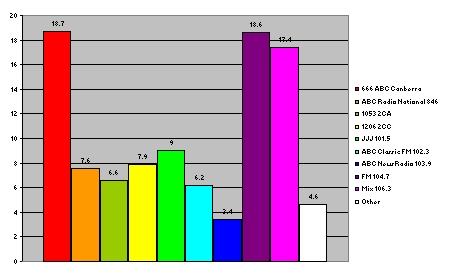
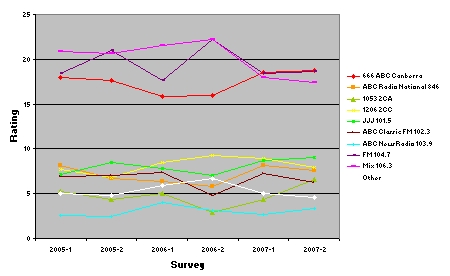
666 ABC Canberra have clearly cemented themselves at the top of the ratings (congratulations to them…but I really can’t understand why…if the audience want to listen to the ABC, Radio National is much better, and if they’re not fussed about whether the station they are listening to is an ABC one or not then 2CC is the best talk radio station in Canberra in my opinion), 2CA are making an impressive comeback, and ABC Classic FM are losing ground quickly. 2CC have now lost ground for two consecutive surveys (although I have been informed that Mike Frame’s weekend programs are rating between 14% and 16% in their timeslots, and are the highest rating programs of any 2CC presenter, local or otherwise). FM 104.7 did much better than their sister station Mix 106.3, and JJJ continue to gain.
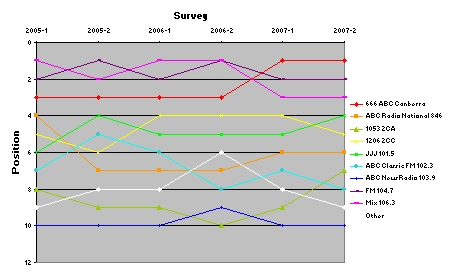
It is quite interesting to see how the leaderboard has changed over time (Excel refused to reduce the Y axis range to “1 to 10”).
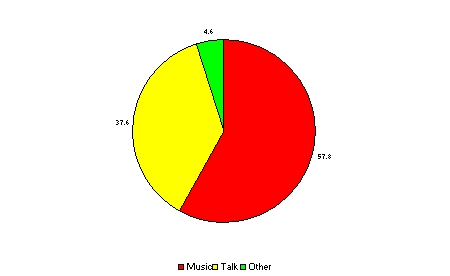
I think it is quite interesting to see the segmentation of the market between the talk and music stations, and how it changes over time.
| Position | (Last Survey) | Category | Score | (Last Survey) | Change |
| 1 | 1 | Music | 57.8 | 56.7 | +1.1 |
| 2 | 2 | Talk | 37.6 | 38.3 | -0.7 |
| 3 | 3 | Other | 4.6 | 5.0 | -0.4 |
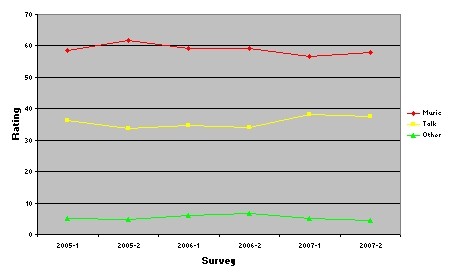
There are five music stations and four talk stations in Canberra, so it is also interesting to see the average rating of each station in each category.
| Position | (Last Survey) | Category | Score | (Last Survey) | Change |
| 1 | 1 | Music | 11.56 | 11.34 | +0.22 |
| 2 | 2 | Talk | 9.40 | 9.575 | -0.175 |
ABC and Commercial audiences.
| Position | (Last Survey) | Category | Score | (Last Survey) | Change |
| 1 | 1 | Commercial | 50.5 | 49.6 | +0.9 |
| 2 | 2 | ABC | 44.9 | 45.4 | -0.6 |
| 3 | 3 | Other | 4.6 | 5.0 | -0.4 |
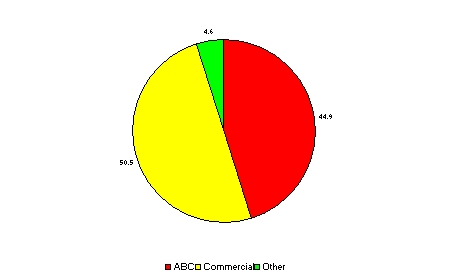
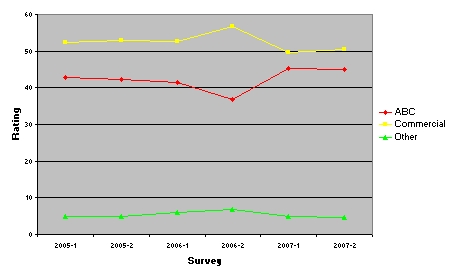
There are five ABC stations and four commercial stations…therefore the averages of the stations in each category.
| Position | (Last Survey) | Category | Score | (Last Survey) | Change |
| 1 | 1 | Commercial | 12.625 | 12.4 | +0.225 |
| 2 | 2 | ABC | 8.98 | 9.08 | -0.10 |
And probably my favourite category comparison…the battle of the bands.
| Position | (Last Survey) | Catgeory | Score | (Last Survey) | Change |
| 1 | 1 | FM | 54.6 | 55.1 | -0.5 |
| 2 | 2 | AM | 40.8 | 39.9 | +0.9 |
| 3 | 3 | Other | 4.6 | 5.0 | -0.4 |
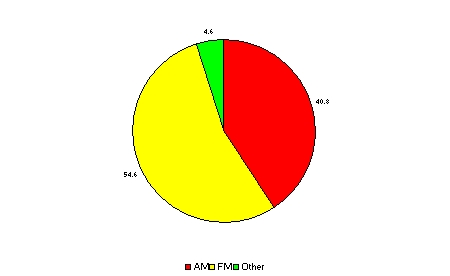
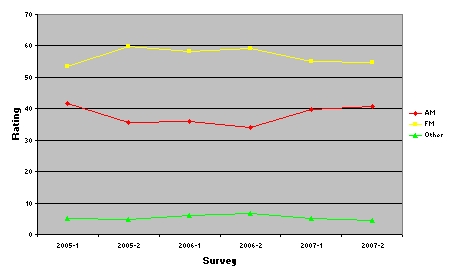
FM might still be winning, but this is the second consecutive gain for AM!
The averages based on four AM stations and five FM stations.
| Position | (Last Survey) | Category | Score | (Last Survey) | Change |
| 1 | 1 | FM | 10.92 | 11.02 | -0.1 |
| 2 | 2 | AM | 10.2 | 9.975 | +0.225 |
So far the date for the first survey of 2008 has not been announced.
Entry Filed under: Canberra Stories,TV/Radio/Media

4 Comments
1. Terry_Wrist | September 19th, 2007 at 7:29 am
Mike Frame’s show may have the highest share of listeners compared to all the programs on 2CC but probably only about a handful of the number of listeners that shows like Breakfast or Laws has on 2CC – there aren’t as many listeners on weekends!
Don’t always accept what the Spin Doctors have to say Sammy
2. Samuel | September 19th, 2007 at 7:35 am
That’s true…it would be interesting to see the audience number figures, but alas Nielsen didn’t respond to my request for a quote to access the ratings data.
3. Samuel | September 19th, 2007 at 5:38 pm
And amazingly they choose today to respond…still no quote though!
4. Pen 15 | September 20th, 2007 at 6:31 pm
I love pie charts. And I love pie.