Obama’s first hundred days by the polls
April 30th, 2009 at 06:06am
US President Barack Obama has racked up his hundredth day in office, and whilst the polls aren’t looking good for him, I’m not willing to declare it all doom and gloom for his administration just yet.
Whilst it is true that his approval rating is the second lowest for the hundred day mark of any president in the last 40 years (56% according to Gallup, Bill Clinton was the only one with a lower score on 55%), and whilst it is true that the trend line is going down, it is also important to note that Mr. Obama received 52.9% of the popular vote in the election, compared to 45.7% for John McCain. Every major poll has Obama’s approval rating above 52.9%, which indicates to me that he still has enough support to win an election.
So, a look at the polling data. Two days after the election when Rasmussen started maintaining a presidential approval rating for Barack Obama, he had:
Strongly approve: 40%
Total approve: 52%
Total disapprove: 44%
Strongly disapprove: 32%
By inauguration day (January 20, see above link) he had improved his strong approval rating slightly, and halved his strong disapproval rating:
Strongly approve: 41%
Total approve: 67%
Total disapprove: 32%
Strongly disapprove: 16%
Today (29 April US time, the date of the 100th day) the approval rating is still slightly higher than post-election, but the strongly approve rating is down. The disapproval ratings are both slightly lower than post-election.
Strongly approve: 35%
Total approve: 55%
Total disapprove: 43%
Strongly disapprove: 31%
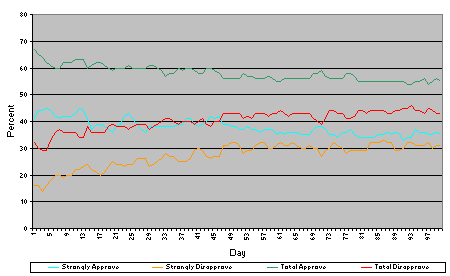
I personally don’t see the point in graphing the days before Obama was inaugurated as he really had no control over anything in that time, but the first hundred days on the other hand are worth graphing:

Data courtesy Rasmussen Reports, LLC
Approval is down, disapproval is up, but as I said earlier, we’re really only getting back to election day levels. If the graph proves anything, it’s that post-election Obamamania (some people would call it the “honeymoon period”) is dieing off, and sensible scrutiny is starting to set in. I suppose the fact that Obama’s approval rating at this point in his presidency is the second lowest in forty years should be some cause for concern, but as his approval rating is still higher than his election score, I don’t think it’s cause for panic in the administration just yet.
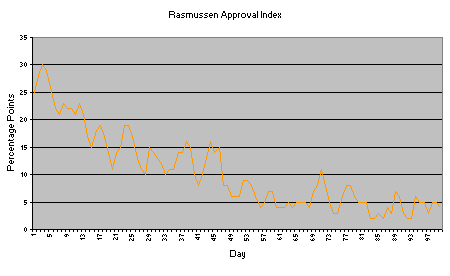
The statistic that I find more interesting than the raw approval numbers is what Rasmussen call the “Presidential Approval Index” where they subtract the strongly disapprove figure from the strongly approve figure. It is arguably more useful as a daily tracking poll than the raw approval index:

Data courtesy Rasmussen Reports, LLC
I’m thinking that it might be worthwhile revisiting the approval numbers on a monthly basis. Clearly there is no point in looking at them again in two days time when the end of April numbers come in, but perhaps we’ll do this again at the end of May…or I might have to run a “poll alert” if the approve/disapprove lines cross before then.
Samuel
Entry Filed under: General News
